
Trade Edge Alpha/Strategy guides/ORB Second Break
ORB Strategy Up 38% on NQ: The Second Break
Most opening range breakouts fail. This is the one trade that shows up after they do.
The ORB strategy, short for opening range breakout strategy, is one of the most taught setups in open range trading. Tested properly, with real trading costs, the standard version mostly does not hold up. The trade that did was the opposite of what most people take: wait for the first breakout to fail, then trade the second break through the other side of the range. Below is why the normal ORB falls over, the exact second break rules, the real ORB strategy success rate from 12 years of data, and a full year backtest on NQ.
Market
NQ / MNQ
Chart
5 minute
Opening range
First 15 min
from 9:30 NY
Max trades
1 per day
Key results
In short
Mark the opening range, ignore the first break, and only trade when price fails back through the range and closes beyond the other side.
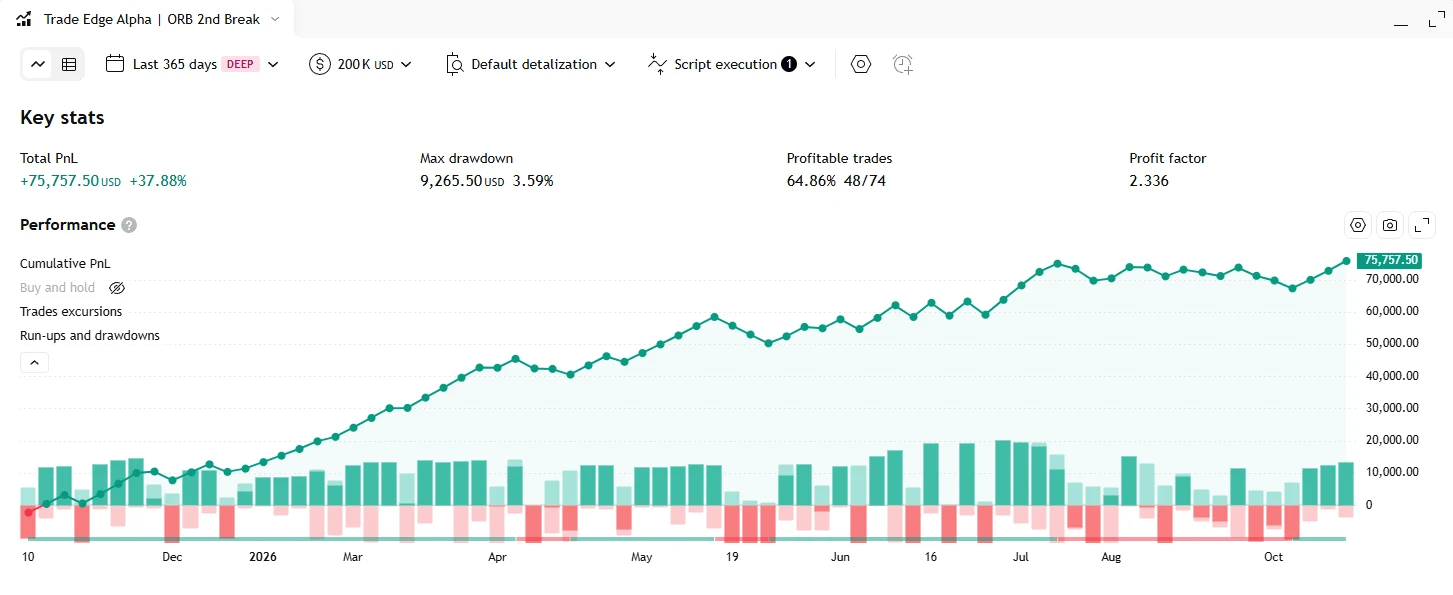
- +37.88% in 365 days on NQ: +$75,757 on a $200K account at 9 contracts, one trade a day at most.
- 2.34 profit factor and a 64.9% win rate over 74 trades.
- 3.59% max drawdown ($9,266), about 1.4 trades a week.
- The classic 5 minute ORB on the same market came out at a 0.89 profit factor, a loser.
- Across 12 years of ES and NQ data the second break closed in profit 55% to 72% of the time, depending on range length.
The problem with ORB
Why most opening range
breakout strategies fail
The classic opening range breakout says: mark the high and low of the first few minutes of the session, then buy a break above or sell a break below. It is simple, it looks great on cherry picked charts, and it is the first strategy a lot of traders learn.
Before landing on the second break I tested the usual versions on NQ over a full year. None of them was an edge. The plain 5 minute ORB lost money outright, and even the best tuned variant only reached a profit factor of 1.20, which is too thin to survive slippage and commission in live trading.
0.89
5m ORB · NQ
Profit factor
1.25
Asia sweep · NQ
Profit factor
1.20
Best tuned ORB
Profit factor
0/225
Study combos that
survived costs
The published research says the same thing. The most rigorous study I found was pre-registered, meaning the tests were fixed before the results were seen. It ran opening range breakouts across 9 futures markets and 16 years of 1 minute data, testing 225 combinations of range length and exit rules. After a realistic $25 round turn cost, not one of them survived. The 5 minute range was the worst of the lot.
| Classic 5 min ORB | ORB second break | |
|---|---|---|
| Entry | First candle close outside the range | Close through the opposite side after the first break fails |
| How often it trades | Most days | About 1.4 times a week |
| Profit factor, 1 year of NQ | 0.89 | 2.34 |
| Win rate, 1 year of NQ | Not an edge | 64.9% |
| Published research | 0 of 225 combinations survived costs | 55.3% to 72.2% win rate over 12 years |
The setup
How the ORB second
break strategy works
The second break flips the logic. Instead of trading the first move out of the range, you treat it as information. A lot of first breaks fail: price pokes out, traps the breakout traders, then reverses back through the range. When that reversal carries all the way through and closes beyond the opposite side, the traders who bought the first break are now offside, and that is the trade.
It also means most days you do nothing. If only one side of the range gets taken and price keeps going, there is no setup and you sit out.
Step 01
First break: log it
The first candle that closes outside the opening range, in either direction, is noted and nothing more. No trade. It tells you which side the market tried first.
Step 02
Second break: enter
If price then fails, comes back through the range and a candle closes beyond the opposite side, enter in that direction on the next bar. First break up, second break down means short. First break down, second break up means long.
The rules
Exact entry, stop
and target
- Chart. NQ or MNQ on the 5 minute chart, New York cash session from 9:30 a.m.
- Opening range. The high and low of the first 15 minutes. A 30 minute range is also worth testing, see the data below.
- First break. A candle close beyond either side of the range. Log the direction, take no trade.
- Entry. A candle close beyond the opposite side of the range. Enter at the open of the next bar.
- Stop and target. Both sized from the daily average true range, so the trade scales with how volatile the market is rather than with how wide the morning range happened to be.
- Frequency. One trade per day at most. No new entries late in the session.
- No second break, no trade. If only one side of the range breaks, the day is skipped.
| Instrument | NQ (MNQ for smaller accounts) |
|---|---|
| Chart | 5 minute |
| Opening range | 9:30 to 9:45 a.m. New York (first 15 minutes) |
| First break | Candle close outside the range. Logged, not traded |
| Entry | Candle close beyond the opposite side, enter next bar open |
| Direction | Long and short, whichever way the second break goes |
| Stop and target | Sized from daily ATR |
| Max trades | 1 per day, no late session entries |
Twelve years of opening ranges
ORB strategy
success rate
The reason to trust this more than a single backtest is the size of the sample behind it. TradingStats.net ran every ES and NQ session from 2014 to 2026, 6,142 trading days, through the same opening range rules and recorded what happened after each break.
39%
Days both sides
get taken
72.2%
Second break
closes in profit
12 yrs
ES + NQ
2014–2026
~92 min
Median wait
after the range
On NQ with a 30 minute opening range, both sides of the range were taken on 39% of days, so roughly 4 days in 10. On those days the second break was the one that closed in profit 72.2% of the time. Most traders are already stopped out of the first break by the time it prints.
A bigger range gives better odds
The edge grows with the length of the opening range. That is also why the 5 minute ORB tests so badly: a range that short is mostly noise.
ES · 5 min range
55.3%Second break win rate
ES · 30 min range
67.9%Second break win rate
NQ · 30 min range
72.2%Second break win rate
Not one lucky year
Every year of the sample landed in the same 55% to 69% band, nowhere near a coin flip. And it is not a fast trade. The median wait from the range closing to the second break was around 88 to 96 minutes, which makes it closer to a late morning or lunchtime trade than an opening bell scalp.
The test
So I coded it up and
backtested a full year
Twelve years of statistics is one thing. Whether it survives as a mechanical strategy with stops, targets, slippage and a fixed contract size is another, so I built the second break as a TradingView indicator and a backtestable strategy and ran it over 365 days of NQ. Full breakdown in the video.
Why ORB fails, the second break rules, and the 365 day result
Does it hold up
What the backtest
actually showed
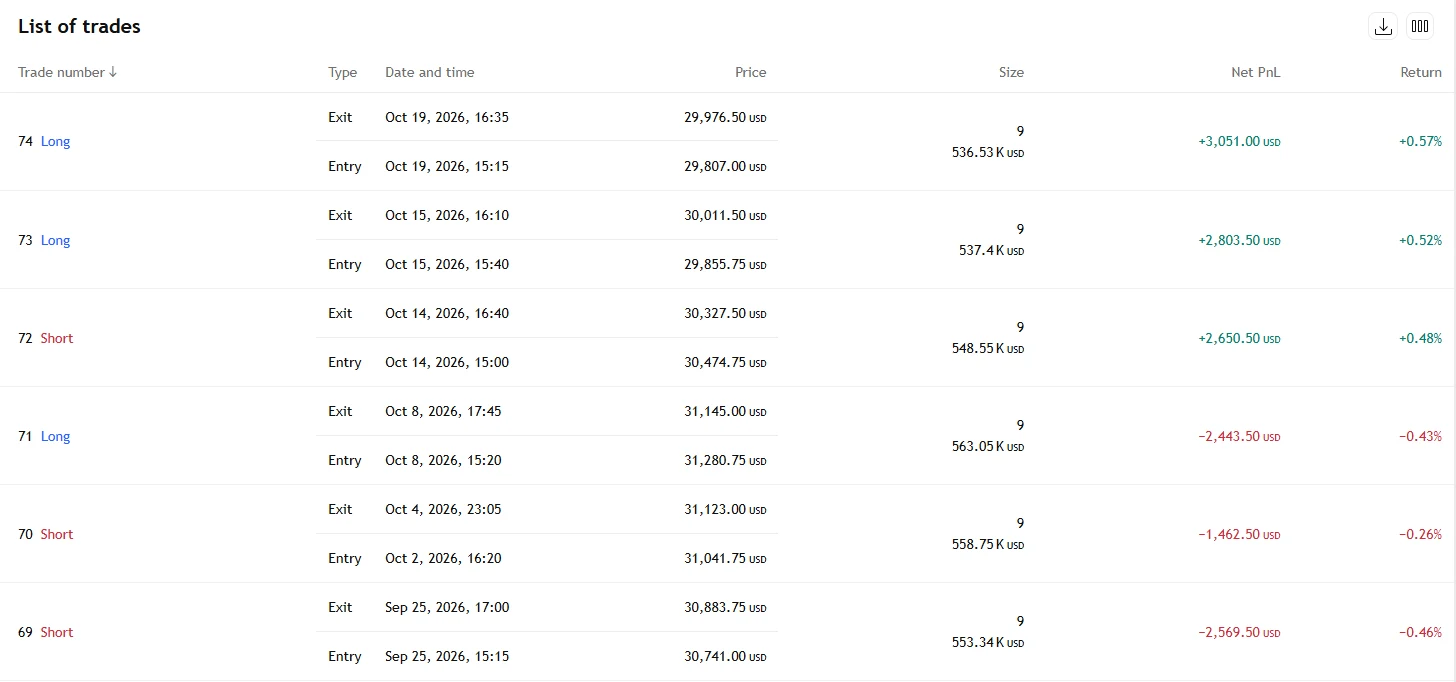
NQ, 5 minute chart, 15 minute opening range, the 365 days to 20 October 2026, run in the TradingView strategy tester on a $200K account at 9 contracts. These are hypothetical results from historical data and they are not a forecast.
+$75,757
Net profit
+37.88%
2.34
Profit factor
64.9%
Win rate
48 of 74 trades
3.59%
Max drawdown
$9,266
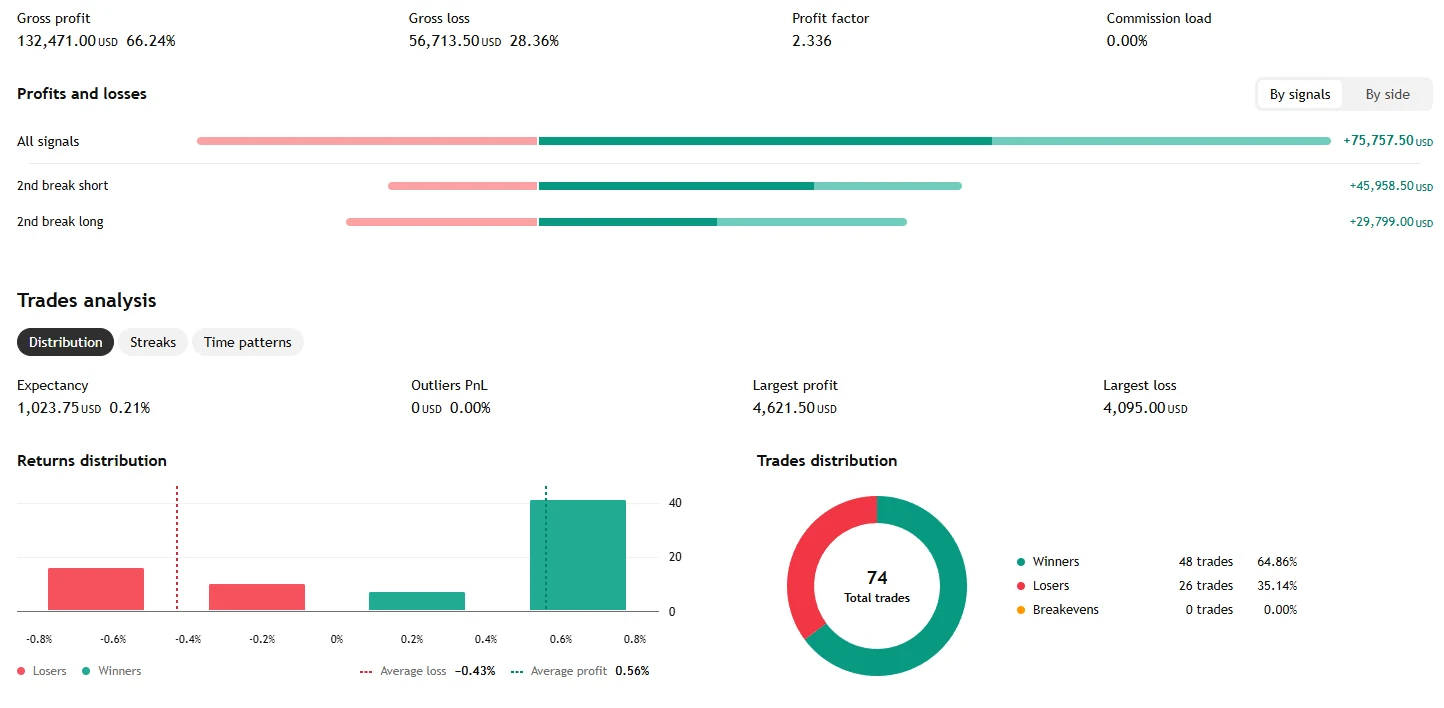
That works out at about $1,024 per trade on average, at roughly 1.4 trades a week. Low frequency is the point: the strategy spends most days doing nothing.
| Test period | 365 days to 20 Oct 2026 |
|---|---|
| Market and chart | NQ, 5 minute, 15 minute opening range |
| Account and size | $200,000, 9 contracts, size not scaled up as the account grew |
| Net profit | +$75,757 (+37.88%) |
| Profit factor | 2.336 |
| Total trades | 74 (48 winners, 26 losers) |
| Win rate | 64.86% |
| Gross profit / gross loss | $132,471 / $56,714 |
| Average per trade | About $1,024 |
| Average win / average loss | +0.56% / −0.43% of equity |
| Largest win / largest loss | $4,622 / $4,095 |
| Shorts / longs | +$45,959 / +$29,799 |
| Max drawdown | $9,266 (3.59%) |
| Commission | Not included |
| Frequency | About 1.4 trades a week |
The honest bit
Shorts did most of the heavy lifting in this sample, $45,959 against $29,799 from longs. The 12 year study found a structural long bias on these indexes, which is the opposite of my year. So the skew is the market I happened to test, not a rule, and I did not build a short only version. Curve fitting one year of data is how backtests lie.
On a funded account, size it down
At 9 contracts that 3.59% drawdown would use about 72% of a typical 5% drawdown limit, one bad run away from a breach. Scaled to 3 contracts, the same trades return about 12.6% with a 1.2% drawdown, roughly 24% of the limit, which leaves room to survive to a payout.
9 contracts
37.88% · 3.59% DD
About 72% of a 5% drawdown limit used. Fine on a personal account sized for it, risky on an evaluation.
3 contracts
12.6% · 1.2% DD
About 24% of a 5% limit used. Same trades, scaled linearly, with room to absorb a losing streak.
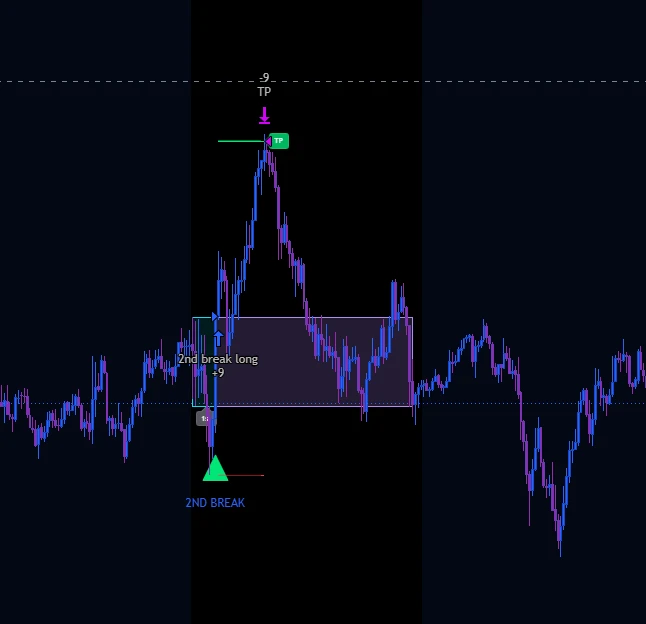
What a trade looks like
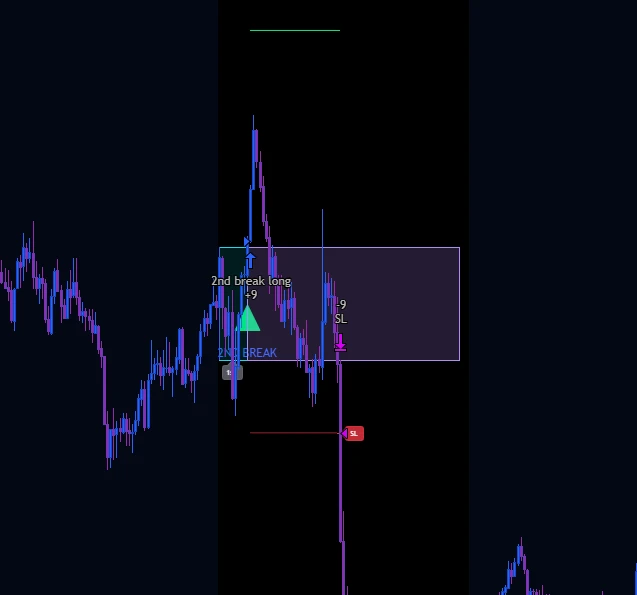
A winning long. Price broke below the opening range first, which was logged and not traded. It then turned, came back through the range and closed above the high: that second break was the long entry, and price ran to the target. The second chart is the same setup failing: the long pushed higher, then reversed straight back through the range into the stop. Losing trades like this were 26 of the 74.
The strategy behind these numbers
ORB Second Break indicator + strategy
The exact Pine Script used for this backtest. Marks the range, labels the first break, flags the entry, draws the stop and target, and runs in the TradingView strategy tester so you can check every number on this page yourself. Full source code, one time price, no subscription.
Backtest updates
Update log
Markets change, and a backtest is only as good as its last run. The numbers above are always the latest run. Every earlier run stays in this log, dated, so you can see how the strategy holds up over time.
Re-ran the test on the 365 days to 20 October 2026: +$75,757 (+37.88%), 2.336 profit factor, 64.86% win rate over 74 trades, 3.59% max drawdown. Added the strategy tester screenshots, the full statistics table, the backtest settings and a comparison with the classic 5 minute ORB.
Published with the 365 day NQ backtest: +$81,031, 2.53 profit factor, 66.2% win rate over 74 trades, 3.45% max drawdown.
Common questions
ORB Second Break FAQ
How much did the ORB strategy make in a year?
In a 365 day TradingView backtest on NQ, the ORB second break returned +$75,757, or +37.88%, on a $200K account trading 9 contracts. That came from 74 trades with a 64.9% win rate, a 2.34 profit factor and a 3.59% maximum drawdown. At 3 contracts the same trades return about 12.6%. Backtested results are hypothetical and are not a forecast.
Does the opening range breakout strategy work?
The standard version mostly does not once trading costs are included. A pre-registered study tested 225 opening range breakout combinations across 9 futures markets and none survived realistic costs. My own tests of a 5 minute ORB on NQ came out at a profit factor of 0.89. The setup that held up was the second break, which only appears after the first breakout fails.
What is the ORB strategy success rate?
It depends which version. The standard ORB strategy has a poor success rate once costs are in: a pre-registered study found none of 225 opening range breakout combinations survived a $25 round turn cost, and my own 5 minute ORB test on NQ ran at a profit factor of 0.89. The second break is different. Across 12 years of ES and NQ data it closed in profit 72.2% of the time on a 30 minute NQ range, 67.9% on a 30 minute ES range and 55.3% on a 5 minute ES range. In my 365 day NQ backtest it won 64.9% of trades.
What is the ORB second break?
Mark the opening range, ignore the first break in either direction, and only trade if price then fails, comes back through the range and closes beyond the opposite side. That second break is the entry, in the direction of the second break.
How often does the setup happen?
On NQ with a 30 minute opening range, both sides of the range were taken on about 39% of days in a 12 year sample, so roughly 4 days in 10. On the other days there is no trade. In my 365 day backtest it worked out at about 1.4 trades per week.
What opening range length works best?
In the TradingStats.net data the second break win rate rose with the size of the range: 55.3% on a 5 minute ES range, 67.9% on a 30 minute ES range and 72.2% on a 30 minute NQ range. In my own NQ backtest a 15 minute range tested best, so both 15 and 30 minutes are worth checking on your own data.
Where do the stop and target go?
Both are sized from the daily average true range rather than from the opening range itself, so the trade scales with how volatile the market is. One trade per day at most, and no new entries late in the session.
Is the ORB second break strategy profitable?
In my 365 day TradingView backtest on NQ with a 15 minute opening range it returned +$75,757 on a $200K account with 9 contracts: a profit factor of 2.34, a 64.9% win rate over 74 trades and a 3.59% maximum drawdown. That is one year of data on one instrument. Backtested results are hypothetical, and different assumptions on fills, fees and slippage will change the outcome. Test it yourself before risking money on it.
Can I trade it on a funded account?
Size it down. At 9 contracts the 3.59% drawdown would use about 72% of a 5% drawdown limit. At 3 contracts the same trades return about 12.6% with a 1.2% drawdown, roughly 24% of the limit, which leaves room to survive a bad run.
Can I get the indicator?
Yes. The ORB Second Break indicator and the backtestable strategy come as full editable Pine Script source, one time price, no subscription. The indicator marks the range, labels the first break, flags the second break entry, draws the stop and target, and shows a running stats panel. It works on every TradingView plan including free. Get the ORB Second Break pack on Whop.
Sources
- TradingStats.net opening range study, 6,142 days of ES and NQ data, 2014–2026 (not peer reviewed).
- Fetna (2026), pre-registered opening range breakout study across 9 futures markets, SSRN.
- Holmberg, Lönnbark & Lundström (2013), Finance Research Letters.
- Tsai et al. (2019), IEEE Access.
- Toby Crabel’s original opening range breakout work.
Run the test yourself
The ORB Second Break indicator and backtestable strategy, as full Pine Script source you can edit. One time price, no subscription. Works on every TradingView plan including free.